-

The World's Worst PowerPoint Presentations
Convoluted flow charts? Tacky, out-of-focus graphics? Huge blocks of text? Welcome to PowerPoint Hell.
Most of you have probably had to make a PowerPoint presentation, so you probably know the basic rules: Use a lot of bullet points. Don’t overdo the text. Avoid multimedia excesses. Et cetera.
There's also the golden rule of thumb: 10, 20, 30. This means presenting a maximum of 10 slides in a maximum 20 minutes at 30 point text size.
It might seem like pretty basic stuff to you, oh PowerPoint Guru, but unfortunately it’s not so obvious to some other people. We took a stroll through the PowerPoint presentation-sharing site, Slideshare.net, and found a scarily large number of really bad PowerPoint presentations. Here are some of the worst (or should we say best?) ones of the bunch. -
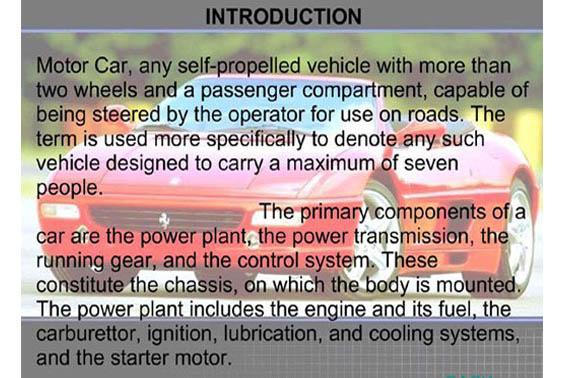
Images and Text Do Not Mix
This PowerPoint presentation on cars (we know it’s about cars because an introductory slide consists of the word "CARS" in huge, garish orange-and-blue letters) puts all of its images in the background (after applying a little tasteful fading), with paragraphs of text overlaid on them. This accomplishes the difficult feat of making the images hard to look at and the text hard to read. Perfect-a lose-lose situation!
The presenter could have consolidated the text in one part of the image, using the image’s horizontal guiding lines; but that didn’t happen, so the slide manages to look sloppy as well as unreadable. -
To Be Fair, Social Networking Is Complicated
The first rule of flow charts is that they should be intelligible. In a presentation, you do have a chance to explain what’s going on, but a good PowerPoint series makes sense on its own. The flow chart presented here is simply baffling and the pictures don’t help much. What’s going where? Who’s getting what? What’s the difference between a one in a big black square and a one in a little red circle? What is a “follower feed”? And why are the some of the "salmon" going downstream?
Nor does this social networking slideshow rally after the incoherent flow chart: It later shows a series of e-mail screen caps that are ugly at best, and incomprehensible at worst. -
A Symmetrical Rainbow of Confusion
Colours are great for attracting an audience. But stick with two or three not six or seven and use them consistently. The colours in this social business map don’t clarify anything. Why are “Social Web” and “Social Enterprise” in different colours but “Cloud/SaaS” and “On-Premise” in the same colour? Why do blue and green diamonds populate orange and white areas as well as blue and green areas? Why does “Trend” appear as two converging white areas while “Standards” appears as a single vanishing brown area?
The whole chart looks like an alien Venn diagram, and the big labels along the bottom appear in random colours that correspond to nothing else on the chart. Why? -
Flow Chart on Steroids
The left side of this PowerPoint slide on customer lifetime value in service contracts does pretty well (If you overlook the iffy capitalization, the wacky punctuation, and the inconsistent framing of the “Modeling issues”): The text is in short bullet points, colours and fonts are restrained, and the presenter used a basic slide template (when in doubt, use a template!).
But then we get to the flow chart. Presumably the red arrows are there to explain what’s going on in the maze of black arrows. The red arrows are somewhat helpful, except for the jarring overlay of red on black. As for the 10,000 black arrows, they probably make a point, or something, but really? -
The Endless “Summary”
Filling an entire PowerPoint slide with text is never a great idea especially not when the content is printed in 10-point type and is three or four times longer than the Gettysburg Address. Even worse is the idea of using an impenetrable slab of 10-point text to provide an executive summary of the ensuing presentation. It’s hard to imagine what useful thing the presenter thought this slide would accomplish no one is going to want to read the text, and if the presenter does so, what’s left to say in the Presentation?
The most chilling part of this cautionary tale? The audience hasn’t even seen the entire “executive summary” yet it continues on the next slide. -
100 Graphs in One Little Slide
Graphs and charts are usually PowerPoint presentation gold: They’re visual, informative, and hard to screw up. So, obviously, the more graphs and charts, the better right? Like, say, 100 graphs and charts. And to sweeten that deal, let’s put all 100 of ‘em on one slide. What could go wrong?
Or rather, what couldn’t go wrong? The whole PowerPoint presentation on lung cancer surgery is pretty bad, but this slide showing 100 charts neatly stacked like coffins in a ten-by-ten array takes the cake. Not only are the graphs so small as to be unreadable, but did we mention there are 100 of them? Oh, and a slide heading that makes sense in English would’ve been nice. -
Slides With Ads - Are They Clickable?
What’s worse than using generic Microsoft clip art in a PowerPoint Presentation? Using a Web banner ad as the top image across all of the slides—that’s what. The creator of this presentation about a snoring solution didn’t even bother to crop off the “Special Offer: Order Now” part of the graphic (which looks as though it were made to run on Yahoo Chat pages, circa 1999).
Hey, we’re all for blatantly touting your Website during a PowerPoint presentation (though you really should limit your self-promotion to the first or last slide not both or you may induce shill fatigue), but decorating a presentation with your company’s online banner ads is pretty cheesy. -
The Case of the Invisible Text
PowerPoint slide transitions are best left to the fourth-grade science fair crowd. But if you insist on using them (don’t say we didn’t warn you), make sure that your text doesn’t behave like a Cheshire cat.
In a PowerPoint presentation on the Future Of Learning Technology, the slides leading up to this one (slide 18) are visually interesting and don’t overdo the text or graphs. But slide 18 contains three bullet-type points that appear and then disappear as the presenter clicks through it. The only thing worse than putting multiple paragraphs of text into a slide is putting up text that vanishes unexpectedly. It’s supposed to be a visual aid, not a magic show. -
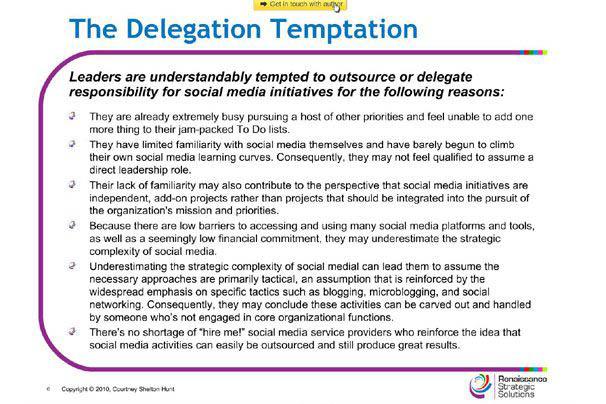
Bad Bullet Points
In a PowerPoint presentation, reducing paragraphs to bullet points helps your audience follow the presentation more easily. But "reducing paragraphs to bullet points" doesn’t mean sticking bullet-point icons in front of paragraphs.
As a rule of thumb, if you have to resize your text to 12- or 10-point type to get it to fit, you have too much text. This presentation on social media from the SMinOrgs S.M.A.R.T. Blog is a great example of bullet points gone bad. The text is tiny, the bullet points are longer than ten words each, and at least one of them is a full-fledged paragraph.
For more PowerPoint sins to avoid, check out PowerPoint Hell: Don’t Let This Happen to Your Next Presentation.
Top 10 world's worst PowerPoint presentations
10 Photos
Follow these top PowerPoint tips and get the best Powerpoint templates online. Don't design bad presentation slides like these.